
arrow_back
Calendar
Finished
· Norway League · First
· Matchday 3
1–1
Draw
24,511 att.
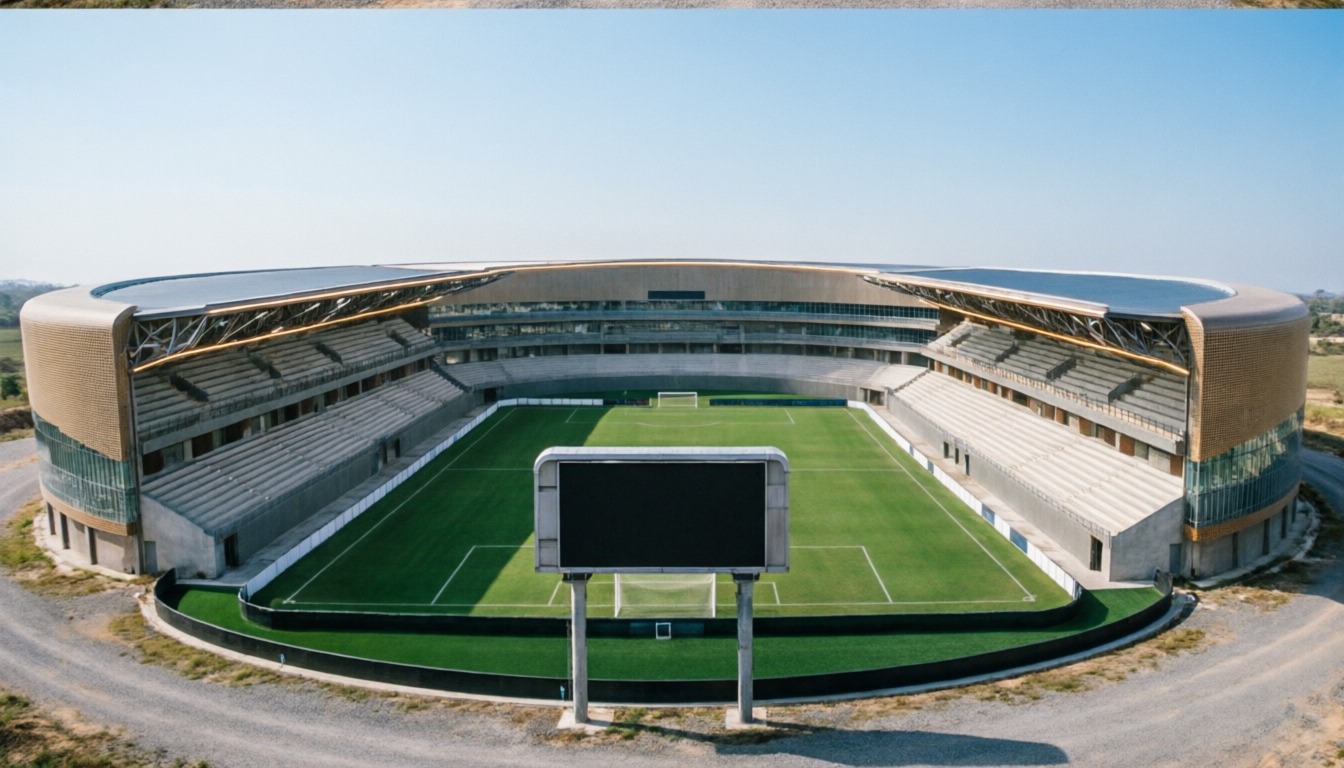
stadiumEstadio de Oslo
TV Televised match
equalizerShots per period · 5 – 3

bar_chartTeam statistics
9
Chances
3
5
Shots
3
3
Shots on target
3
51%
Possession
49%
2
Saves
2
0
Corners
0
6
Crosses
0
1
Yellow cards
0
0
Red cards
0
28'
sports_soccer
ARE
Bounthaiyavong opens up play with a pass
Pass between the lines from Cawley
GOOOAL! Unstoppable shot from Paul
55'
block
OSL
57'
sports_handball
ARE
82'
radio_button_unchecked
OSL
Pettersen threads a pass into the box
Burr puts the ball into the box
Martinus Hanssen settles the ball in the box
Martinus Hanssen crosses into the box
2 goals
4 saves
1 yellows
0 reds
13 plays
Lineups
Oslo SC
4-4-2Bench








Arendal City
4-4-2Bench









Player statistics
What the abbreviations mean
- MIN
-
Minutes
- G
-
Goals
- AST
-
Assists
- SH
-
Shots
- SAV
-
Saves
- TKL
-
Tackles
- RAT
-
Average performance rating
| Player | RAT | MIN | G | AST | SH | SAV | TKL | |
|---|---|---|---|---|---|---|---|---|
| GK Onopco | 6.0 | 90' | – | – | – | 2 | – | – |
| LB Tor | 6.0 | 90' | – | – | – | – | – | – |
| LCB Arnesen | 5.8 | 90' | – | – | – | – | – | |
| RCB Gilberto | 6.0 | 90' | – | – | – | – | – | – |
| RWB Olan | 6.0 | 90' | – | – | – | – | – | – |
| LM Martinus Hanssen | 6.5 | 90' | – | – | 1 | – | – | – |
| CM Burr | 8.1 | 90' | 1 | – | 1 | – | – | – |
| RCM Pettersen | 6.4 | 90' | – | – | – | – | – | – |
| RM Mathisen | 6.0 | 90' | – | – | – | – | – | – |
| LWF Nikolai | 6.2 | 90' | – | – | 2 | – | – | – |
| RS Erlend | 5.9 | 90' | – | – | 1 | – | – | – |
| Player | RAT | MIN | G | AST | SH | SAV | TKL | |
|---|---|---|---|---|---|---|---|---|
| GK Aasen | 6.0 | 90' | – | – | – | 2 | – | – |
| LB Simonsen | 6.0 | 90' | – | – | – | – | – | – |
| LCB Belle | 6.0 | 90' | – | – | – | – | – | – |
| SW Harald | 6.0 | 90' | – | – | – | – | – | – |
| RB Evensen | 6.0 | 90' | – | – | – | – | – | – |
| RDM Alf | 6.3 | 90' | – | – | 1 | – | – | – |
| LM Bounthaiyavong | 6.2 | 90' | – | – | – | – | – | – |
| RCM Burnaby | 6.3 | 90' | – | – | – | – | – | – |
| RM Eide | 5.9 | 90' | – | – | – | – | – | – |
| LWF Paul | 8.0 | 90' | 1 | – | 2 | – | – | – |
| LS Cawley | 7.1 | 90' | – | 1 | – | – | – | – |