
arrow_back
Calendar

Finished
· England League · Second
· Matchday 2
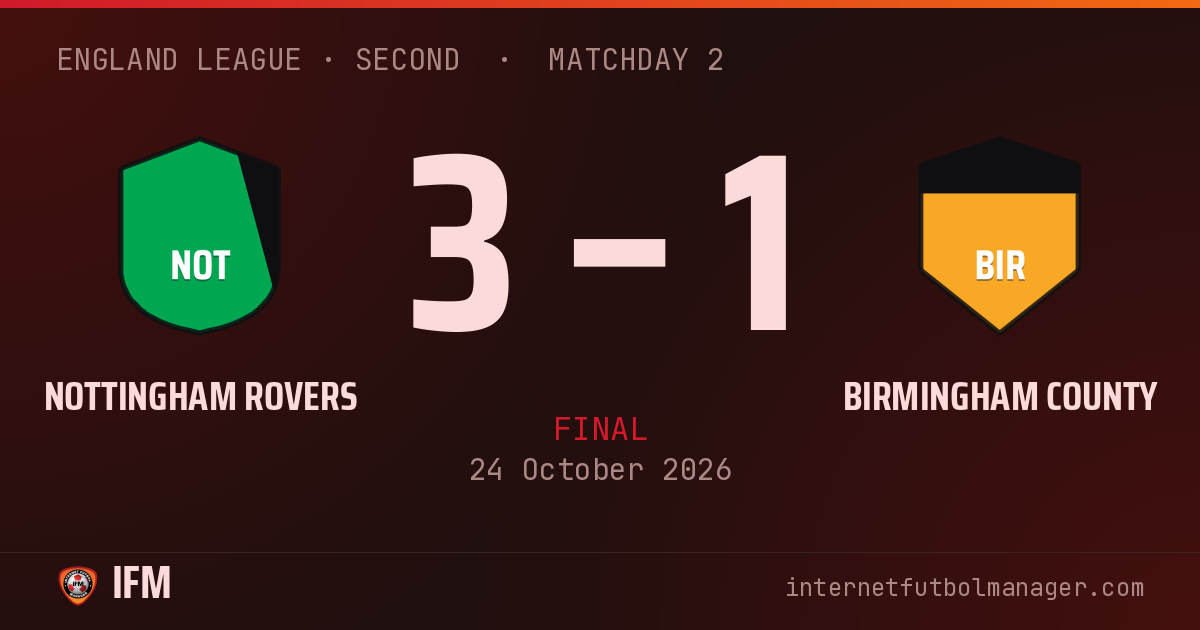
3–1
Home win
16,064 att.
stadiumEstadio de Nottingham
equalizerShots per period · 6 – 2

bar_chartTeam statistics
9
Chances
8
6
Shots
2
6
Shots on target
2
45%
Possession
55%
1
Saves
3
2
Corners
0
0
Crosses
1
1
Yellow cards
1
0
Red cards
0
23'
sports_soccer
NOT
Pennant cuts inside and leaves Tyrone behind
Pennant opens up play with a pass
GOOOAL! The striker Rowley finishes the move
31'
sports_soccer
NOT
79'
sports_handball
NOT
Tyler threads a pass into the box
Rowley opens up play with a pass
Pass between the lines from Pennant
4 goals
4 saves
2 yellows
0 reds
20 plays
Lineups
Nottingham Rovers
4-4-2Bench









Birmingham County
4-4-2Bench









Player statistics
What the abbreviations mean
- MIN
-
Minutes
- G
-
Goals
- AST
-
Assists
- SH
-
Shots
- SAV
-
Saves
- TKL
-
Tackles
- RAT
-
Average performance rating
| Player | RAT | MIN | G | AST | SH | SAV | TKL | |
|---|---|---|---|---|---|---|---|---|
| GK Royce | 5.7 | 90' | – | – | – | 1 | – | – |
| LB Storm | 6.3 | 90' | – | – | – | – | – | |
| SW Bobby | 6.9 | 90' | – | – | – | – | 1 | – |
| RCB Samuel | 6.4 | 90' | – | – | – | – | – | – |
| RB Channing | 6.0 | 90' | – | – | – | – | – | – |
| LM Sheldon | 7.3 | 90' | – | 1 | 1 | – | – | – |
| LCM Tyler | 6.5 | 90' | – | – | – | – | – | – |
| CM Pennant | 7.6 | 90' | – | 1 | – | – | – | – |
| RCM Thomas | 6.0 | 90' | – | – | – | – | – | – |
| RS Rowley | 9.2 | 90' | 2 | – | 4 | – | – | – |
| RWF Jools | 7.5 | 90' | 1 | – | 1 | – | – | – |
| Player | RAT | MIN | G | AST | SH | SAV | TKL | |
|---|---|---|---|---|---|---|---|---|
| GK Barker | 5.8 | 90' | – | – | – | 3 | – | – |
| LB Franklin | 5.5 | 90' | – | – | – | – | – | |
| LCB Lanford | 6.4 | 90' | – | – | – | – | 1 | – |
| SW Rob Dyer | 6.0 | 90' | – | – | – | – | – | – |
| RCB Tselikas | 6.0 | 90' | – | – | – | – | – | – |
| LM Lescott | 6.0 | 90' | – | – | – | – | – | – |
| CM Tyrone | 5.7 | 90' | – | – | – | – | – | – |
| RCM Garth Caileigh | 6.9 | 90' | – | – | – | – | 1 | – |
| RM Yuthevong Hen(g) | 6.3 | 90' | – | – | – | – | 1 | – |
| RS Hamrayev | 6.0 | 90' | – | – | – | – | – | – |
| RWF Ross | 7.8 | 90' | 1 | – | 2 | – | – | – |