
arrow_back
Calendar
Finished
· England Cup
· Round of 32 · 1st leg
1–0
Home win
22,978 att.
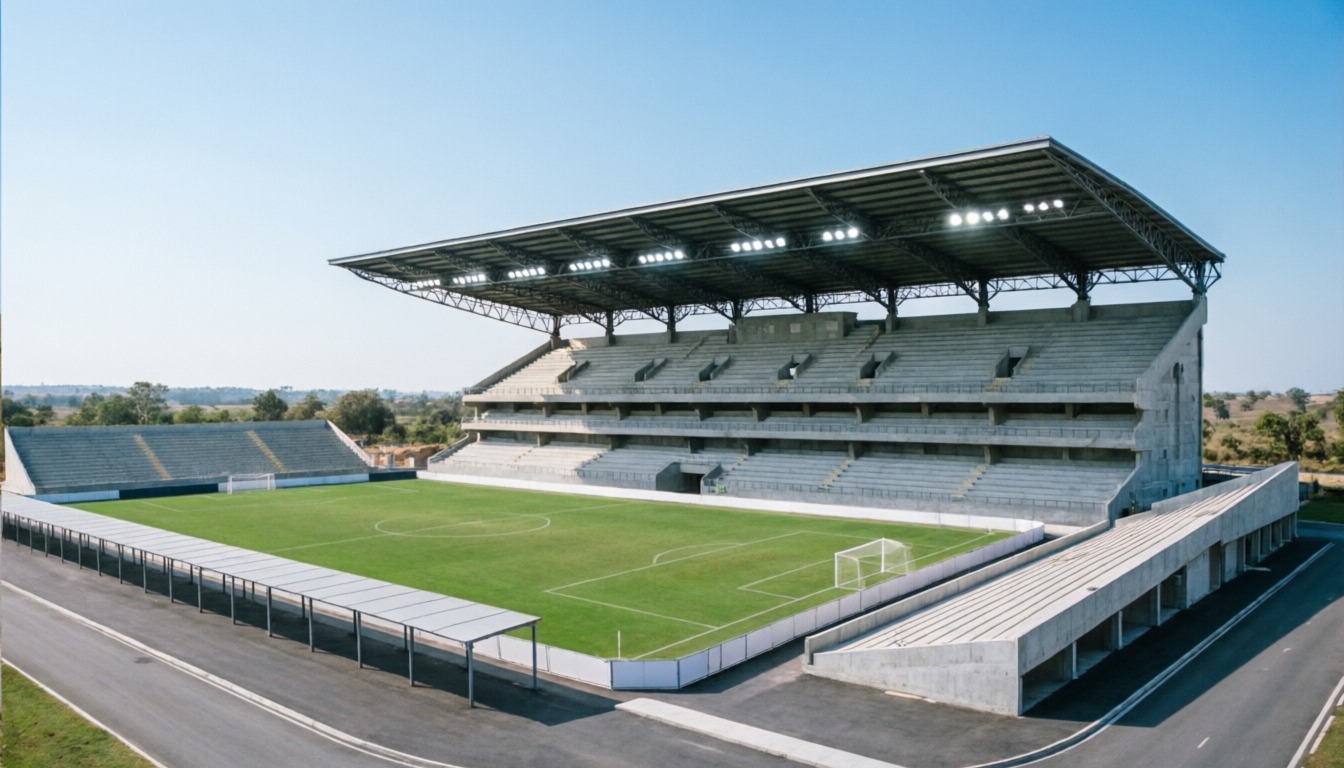
stadiumEstadio de Burton upon Trent
Nottingham Rovers
AwayequalizerShots per period · 5 – 0

bar_chartTeam statistics
9
Chances
0
6
Shots
0
5
Shots on target
0
56%
Possession
44%
0
Saves
4
0
Corners
0
2
Crosses
0
0
Yellow cards
2
0
Red cards
0
32'
sports_soccer
BUR
Jeff Scholes opens up play with a pass
Rowan beats Sheldon with a change of pace
Rowan crosses into the box
OWN GOAL! Sheldon tries to clear but it ends up in his own net
69'
sports_handball
BUR
Jeff Scholes leaves Channing standing
Pass between the lines from Jeff Scholes
Kemo threads a pass into the box
69'
sports_handball
BUR
1 goals
4 saves
2 yellows
0 reds
11 plays
Lineups


















Player statistics
What the abbreviations mean
- MIN
-
Minutes
- G
-
Goals
- AST
-
Assists
- SH
-
Shots
- SAV
-
Saves
- TKL
-
Tackles
- RAT
-
Average performance rating
| Player | RAT | MIN | G | AST | SH | SAV | TKL | |
|---|---|---|---|---|---|---|---|---|
| GK Thompson | 7.0 | 90' | – | – | – | – | – | – |
| LB Keegan | 6.8 | 90' | – | – | – | – | – | – |
| LCB Speer | 6.8 | 90' | – | – | – | – | – | – |
| RCB Glen | 6.8 | 90' | – | – | – | – | – | – |
| RB Brett Delbert | 6.8 | 90' | – | – | – | – | – | – |
| LM Mills | 6.2 | 90' | – | – | – | – | – | – |
| LCM Rowan | 6.4 | 90' | – | 1 | – | – | – | – |
| CM Jeff Scholes | 6.9 | 90' | – | – | 1 | – | – | – |
| RCM Hilton | 6.2 | 90' | – | – | – | – | – | – |
| LW Kemo | 6.7 | 90' | – | – | 2 | – | – | – |
| RWF Henderson | 6.8 | 90' | – | – | 2 | – | – | – |
| Player | RAT | MIN | G | AST | SH | SAV | TKL | |
|---|---|---|---|---|---|---|---|---|
| GK Royce | 7.4 | 90' | – | – | – | 4 | – | – |
| LB Storm | 6.4 | 90' | – | – | – | – | – | – |
| SW Bobby | 6.0 | 90' | – | – | – | – | – | – |
| RCB Samuel | 5.5 | 90' | – | – | – | – | – | |
| RB Channing | 6.0 | 90' | – | – | – | – | – | – |
| LM Sheldon | 4.2 | 90' | 1 | – | 1 | – | – | – |
| LCM Tyler | 5.7 | 90' | – | – | – | – | – | – |
| CM Pennant | 6.0 | 90' | – | – | – | – | – | – |
| RCM Thomas | 6.0 | 90' | – | – | – | – | – | – |
| RS Rowley | 6.0 | 90' | – | – | – | – | – | – |
| RWF Jools | 5.5 | 90' | – | – | – | – | – |