
arrow_back
Calendar
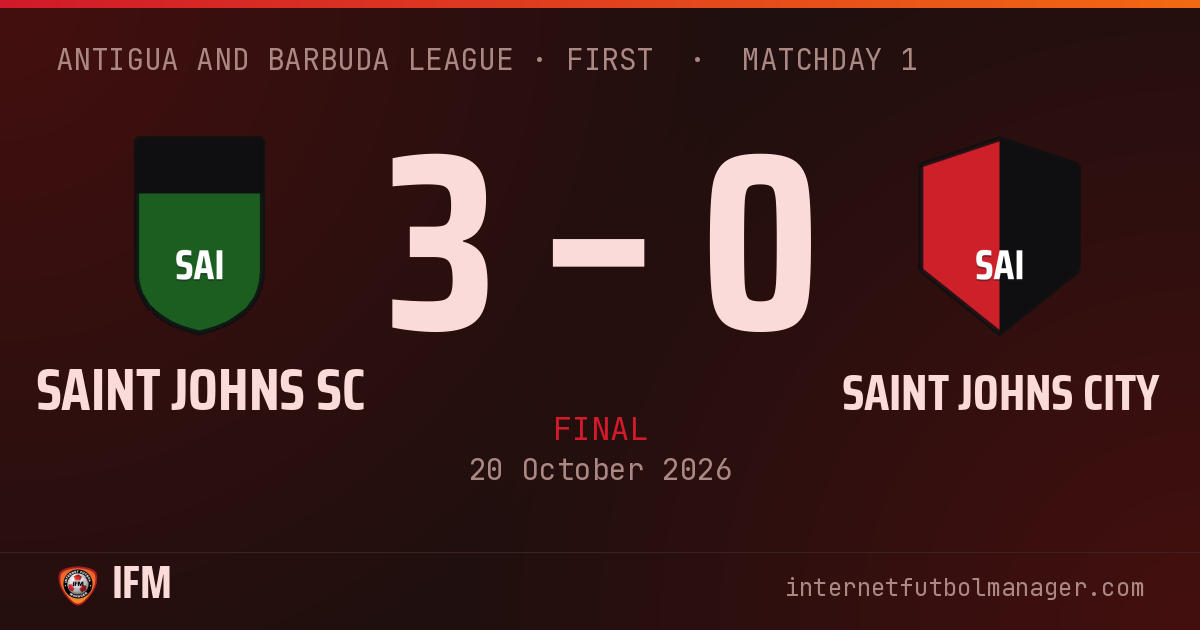
Finished
· Antigua and Barbuda League · First
· Matchday 1
3–0
Home win
25,108 att.
stadiumEstadio de Saint Johns
equalizerShots per period · 5 – 1

bar_chartTeam statistics
13
Chances
5
5
Shots
1
4
Shots on target
1
51%
Possession
49%
1
Saves
1
0
Corners
1
3
Crosses
1
0
Yellow cards
2
0
Red cards
1
22'
radio_button_unchecked
SAI
23'
radio_button_unchecked
SAI
Garfield swings the corner into the box
D. Higgins controls it inside the box
James reads D. Higgins's pass
28'
radio_button_unchecked
SAI
Lester cuts inside and leaves Neil behind
Lester crosses into the box
Robert clears under pressure from Orville Peters
3 goals
2 saves
2 yellows
1 reds
21 plays
Lineups
Saint Johns SC
4-4-2Bench








Saint Johns City
4-4-2Bench









Player statistics
What the abbreviations mean
- MIN
-
Minutes
- G
-
Goals
- AST
-
Assists
- SH
-
Shots
- SAV
-
Saves
- TKL
-
Tackles
- RAT
-
Average performance rating
| Player | RAT | MIN | G | AST | SH | SAV | TKL | |
|---|---|---|---|---|---|---|---|---|
| GK Prince | 7.2 | 90' | – | – | – | 1 | – | – |
| LCB Emil | 6.8 | 90' | – | – | – | – | – | – |
| SW Robert | 6.4 | 90' | – | – | – | – | – | – |
| RCB Schyan | 7.3 | 90' | – | – | – | – | 1 | – |
| RB M. Higgins | 6.8 | 90' | – | – | – | – | – | – |
| LM Karanja | 8.9 | 90' | – | 2 | – | – | – | – |
| CM Alex | 6.7 | 90' | – | – | – | – | – | – |
| RM Marc | 7.7 | 90' | 1 | – | 1 | – | – | – |
| LW Anthony | 6.3 | 90' | – | – | 1 | – | – | – |
| LAM Neil | 5.9 | 90' | – | – | – | – | – | – |
| RS James | 8.4 | 90' | 2 | – | 3 | – | – | – |
| Player | RAT | MIN | G | AST | SH | SAV | TKL | |
|---|---|---|---|---|---|---|---|---|
| GK S. Morgan | 4.7 | 90' | – | – | – | 1 | – | – |
| SW D. Higgins | 4.0 | 90' | – | – | – | – | – | |
| RCB T. Romeo | 6.9 | 90' | – | – | – | – | 2 | – |
| RB Edwin | 5.6 | 90' | – | – | – | – | – | – |
| LWB Mosalem | 6.0 | 90' | – | – | – | – | – | – |
| LM Lester | 6.4 | 90' | – | – | – | – | – | – |
| LCM Malone | 6.2 | 90' | – | – | – | – | – | – |
| CM R. Williams | 5.8 | 90' | – | – | 1 | – | 1 | |
| RM Garfield | 5.9 | 90' | – | – | – | – | 1 | |
| LWF Orville Peters | 6.0 | 90' | – | – | – | – | – | – |
| LS C. Williams | 6.0 | 90' | – | – | – | – | – | – |