
arrow_back
Calendar
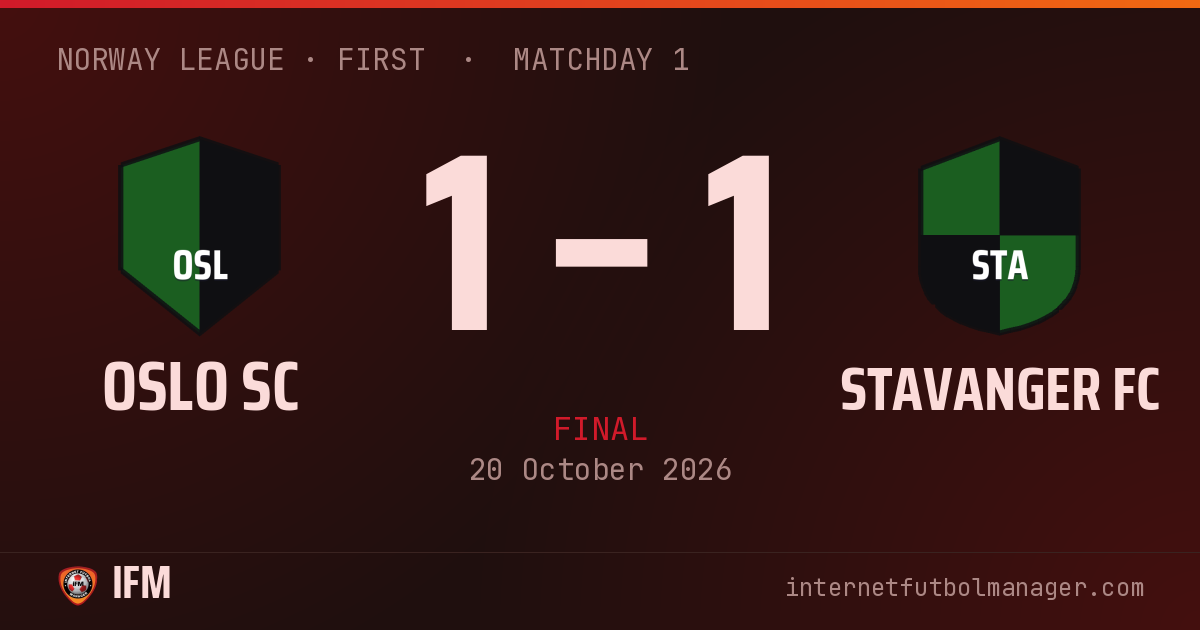
Finished
· Norway League · First
· Matchday 1
1–1
Draw
41,805 att.
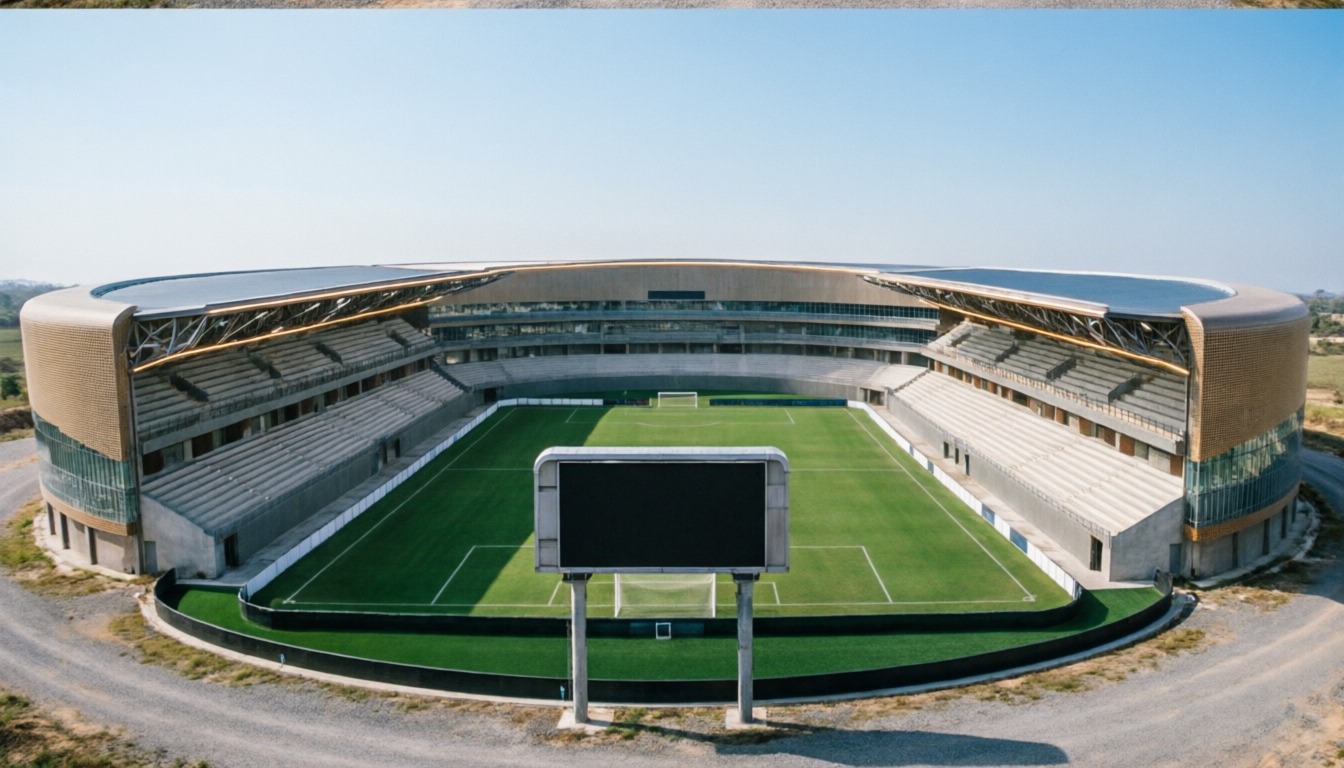
stadiumEstadio de Oslo
equalizerShots per period · 2 – 1

bar_chartTeam statistics
8
Chances
5
2
Shots
1
2
Shots on target
1
46%
Possession
54%
0
Saves
1
0
Corners
1
4
Crosses
3
3
Yellow cards
3
0
Red cards
0
14'
radio_button_unchecked
OSL
15'
radio_button_unchecked
STA
24'
radio_button_unchecked
OSL
42'
radio_button_unchecked
STA
45'
sports_handball
OSL
Gilberto threads a pass into the box
Shot from Martinus Hanssen, pushed away by Christensen
55'
sports_soccer
OSL
Martinus Hanssen leaves Anders standing
Measured cross from Martinus Hanssen
Burr controls it inside the box
Burr leaves José Luis standing
GOOOAL! The midfielder Burr finishes the move
2 goals
1 saves
6 yellows
0 reds
19 plays
Lineups
Oslo SC
4-4-2Bench








Stavanger FC
4-4-2Bench









Player statistics
What the abbreviations mean
- MIN
-
Minutes
- G
-
Goals
- AST
-
Assists
- SH
-
Shots
- SAV
-
Saves
- TKL
-
Tackles
- RAT
-
Average performance rating
| Player | RAT | MIN | G | AST | SH | SAV | TKL | |
|---|---|---|---|---|---|---|---|---|
| GK Onopco | 5.5 | 90' | – | – | – | – | – | – |
| LB Tor | 6.2 | 90' | – | – | – | – | – | – |
| LCB Arnesen | 5.9 | 90' | – | – | – | – | – | |
| RCB Gilberto | 6.1 | 90' | – | – | – | – | – | – |
| RWB Olan | 6.2 | 90' | – | – | – | – | 1 | |
| LM Martinus Hanssen | 7.2 | 90' | – | 1 | 1 | – | – | |
| CM Burr | 7.7 | 90' | 1 | – | 1 | – | – | – |
| RCM Pettersen | 6.4 | 90' | – | – | – | – | – | – |
| RM Mathisen | 6.2 | 90' | – | – | – | – | – | – |
| LWF Nikolai | 6.0 | 90' | – | – | – | – | 1 | – |
| RS Erlend | 6.0 | 90' | – | – | – | – | – | – |
| Player | RAT | MIN | G | AST | SH | SAV | TKL | |
|---|---|---|---|---|---|---|---|---|
| GK Christensen | 5.7 | 90' | – | – | – | 1 | – | – |
| LB Anders | 5.1 | 90' | – | – | – | – | – | |
| RCB Kristian | 5.5 | 90' | – | – | – | – | – | |
| RB Rasmussen | 7.3 | 90' | – | – | – | – | 1 | – |
| LDM A. Nilsen | 6.6 | 90' | – | – | – | – | – | – |
| RWB Tamang | 6.0 | 90' | – | – | – | – | – | – |
| LM José Luis | 6.9 | 90' | – | 1 | – | – | – | – |
| LCM Barjamovic | 6.2 | 90' | – | – | – | – | 1 | – |
| RM Gulbrandsen | 6.0 | 90' | – | – | – | – | – | – |
| LWF Mikkelsen | 6.0 | 90' | – | – | – | – | – | – |
| RWF Quistin | 7.0 | 90' | 1 | – | 1 | – | – |